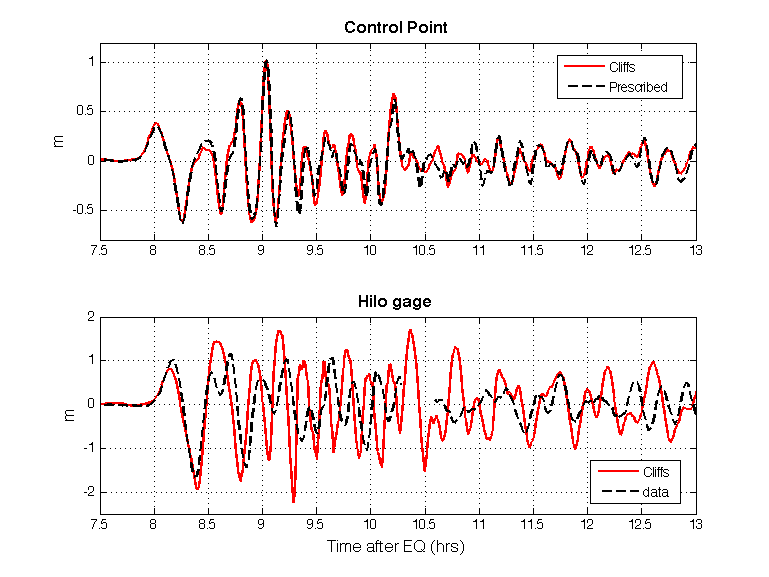
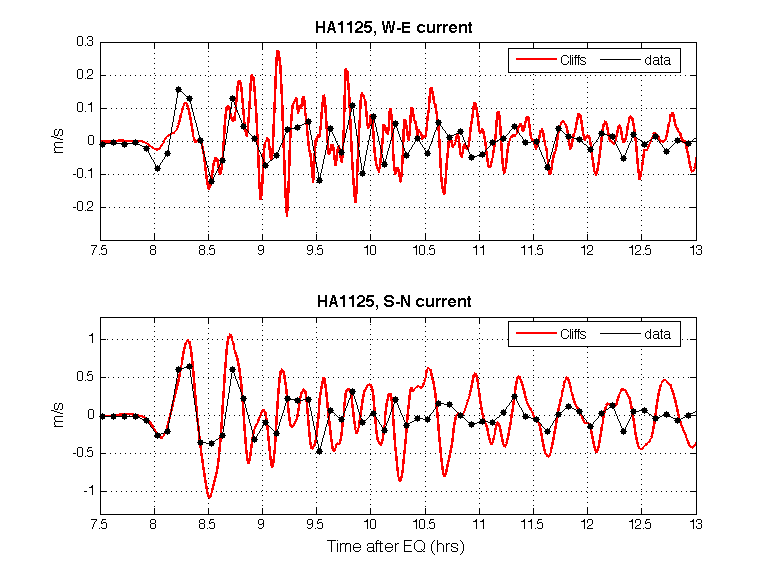
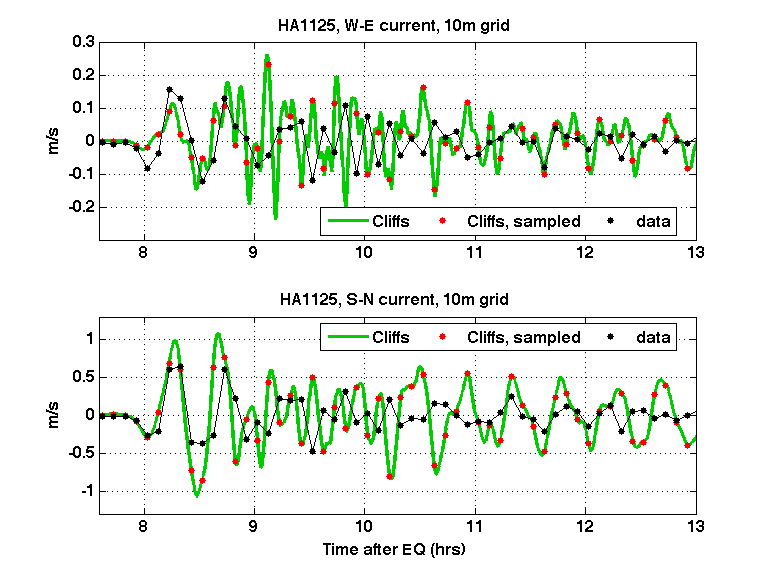
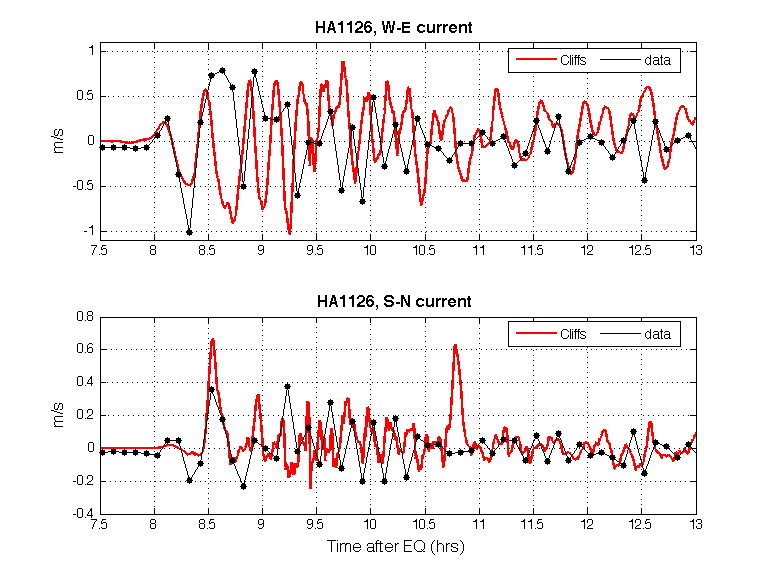
Comparison plots: |
|
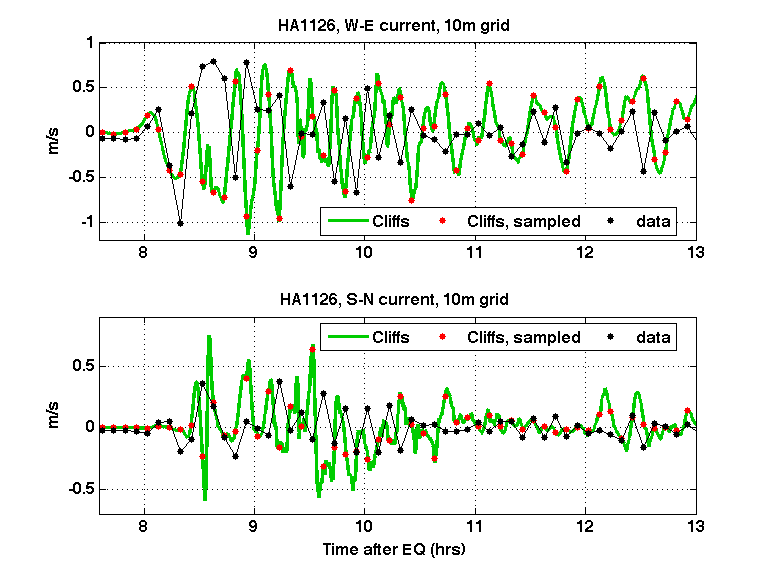
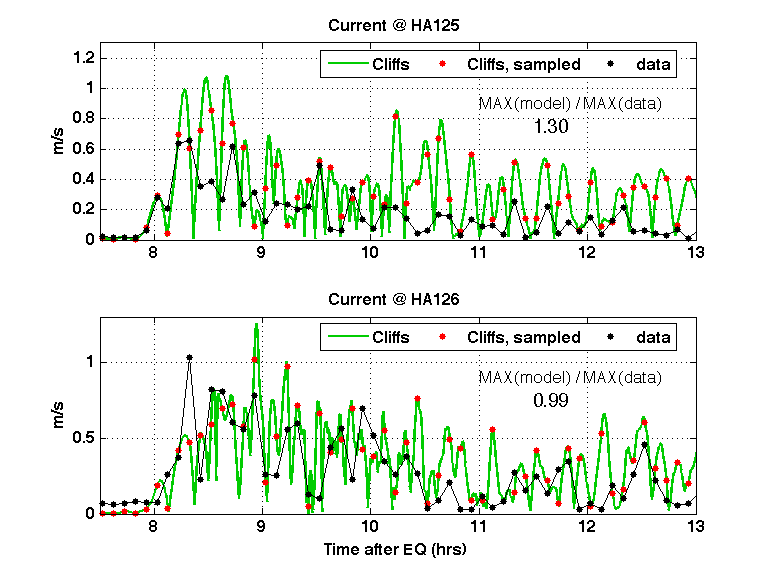
Notes: |
computations with Cliffs at 10m and 20 m resolution, Manning n=0.025; simulations were forced through the upper grid boundary; prescribed input is shifted in time through 25.8 min to match arrival at the gage. |
Benchmark Problem 1 |
Benchmark Problem 3 |
Benchmark Problem 4 |
Benchmark Problem 5 |